Milieuzaken.org
feiten, getallen en opinies
Afkoeling van het limaat
U bent hier: inhoudsopgave - atmosfeer - afkoeling van het klimaat
Afkorting of begrip onbekend ? Raadpleeg ons milieuwoordenboek !
en Facebook of Linkedin
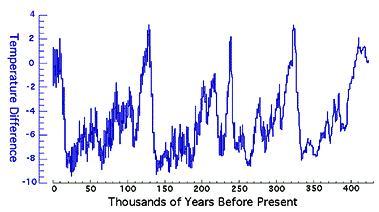
Op onze webpagina over ijstijden wordt begin en einde besproken van de laatste 4 ijstijden, die tesamen een periode belsaan van ca. 400.000 jaar.
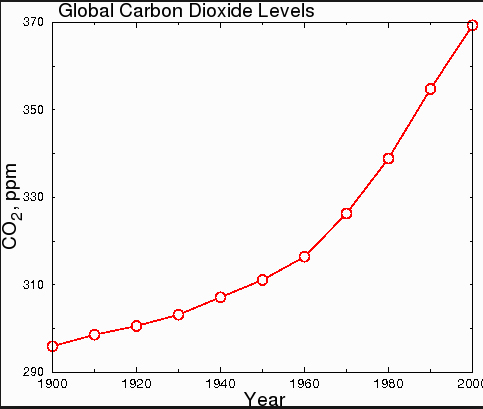
Global Temperatures
During the last couple of decades, much work has been done to try to determine earth's average temperature over a long period of time. One of the ways this is done is by drilling ice samples in Greenland and determining from the layers of ice (much like tree rings) what gases are present and what the average temperature was that year.
Unfortunately, this record over Greenland appears to give valid readings only up until the last inter-glacial period. Luckily enough, the drill records for the Antarctic have recently revealed records over the last 400 thousand years.
Consider this chart of temperatures over a 400 thousand year time period recently gained from ice cores in the Antarctic. Please read from left to right. It starts at current temperatures and goes back in time. It shows the recent spike that marks the end of the last glacial period. Notice the cold periods extend for about 100.000 years and there are 4 warm spikes approx. every 100.000 years that last for an average of 10.000 years. These correspond with readings taken in Greenland over the period of time that Greenland can be measured and are viewed as reflective of overall climate on Earth.
Any description of global warming will have to address the temperature's cyclical nature over the last 400.000 years. |
Extent of Glaciers
Ice coverage of the northern hemispere 18.000 years
before present compared to modern day |
left: earth 18.000 years ago as viewed from the north pole ||||||||||||||| right: earh today as viewed from the North Pole
Het zeeijs is paars gekleurd
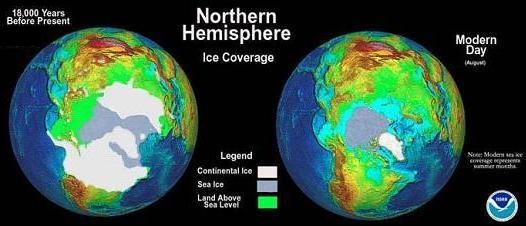
(source: https://www.magazine.noaa.gov/stories/mag95.htm)
Consider these pictures showing ice levels (white and light blue) towards the end of the last glacial period (about 18k years ago) compared to ice levels now (an inter-glacial period). The world was very different, with the ice covering New York, Toronto, Edmonton, Calgary, ... in the 1-2 kilometer range. The sea level was some 100 meters lower than present and the shore lines were closer to what is called the continental shelf, rather than current ocean shore lines. Notice also the land bridge between Alaska and Russia (light green) that facilitated the movement of humans into the Americas from Asia during the last glacial period.
Any description of global warming will have to address the issue of the last 10k years that shows a dramatic reduction in ice buildup over Canada and northern Europe.
During the period of polar ice cap melting, consider the Atlantic Ocean. Most of the cold, fresh water created by the melting flows out through the North Atlantic. Very little comes out to the Pacific just because of how the land is. Remember the movie Red October, where submarines use the rush of cold water deep in the ocean between Iceland and England to travel quickly into the mid Atlantic Ocean. This rush of deep cold fresh water causes a current that forces the surface warmer water to flow north towards Europe and estabilishes most of the overall ocean currents. The warm weather in northern Europe and eastern Canada contributes to and intensifies the melting of the ice cap, which in turn intensifies the warmer northern weather, thus causing more melting, more flow of water and warmer weather yet.
This cycle clearly cannot continue forever. At some point enough of the polar ice cap has melted so that there is no longer such a large net flow of cold water out of the Arctic. At this point the northern flow of warm water on the surface and the warm air flowing into Northern Europe will be reduced. Instead of melting, the Arctic will again start to build up ice. The slow 100k glacial period will start and the buildup of ice will continue over the 100k years since there is no more north Atlantic current to melt the ice. The feedback loop of melting causing warm weather is now replaced with freezing of the ice cap causing cooler weather. The ice cannot build up forever, as the earth absorbs too much energy from the sun to completely freeze up. So at some point, the build up of ice is enough that it starts to melt even though the north Atlantic is not warming it. At that point, the north Atlantic will again start the warming feedback loop and the cycle of dramatic warming (10k years) followed by slow freezeup (100k years) will continue.
Remember too, although the buildup of ice takes a long time, the actual temperature changes in a particular place caused by the flow of the ocean occur on a much smaller time frame. The temperature charts show differences ranging from 2 degrees to 10 degrees celsius occuring over a relatively short time frame (ie. decades). The principle change will come in the flow of the Atlantic Ocean and the related weather changes caused by no more gulf stream affecting the weather in Eastern Canada, the Eastern US and Northern Europe.
Conclusions
The earth has a natural warming and cooling cycle that lasts just over 100 thousand years. The cycle goes from virtually no ice in the arctic, to substantial buildup of ice in the arctic.   The complete melting of the polar ice cap is what triggers the next round of cooling. The natural flow of the Atlantic Ocean is what sustains the warming and cooling cycles. The complete melting of the polar ice cap is what triggers the next round of cooling. The natural flow of the Atlantic Ocean is what sustains the warming and cooling cycles.
The sea level would rise another 6.5 meters if most of the ice on Greenland melts (as it did in the last and every other interglacial period). Also remember that the melting of the ice shield over North American and Europe over the last 10k years has raised sea levels by an estimated 120 meters. How long before all of the Greenland ice melts and sea levels rise another 6 meters? 500 years? 200 years? What will happen after it melts? Will the Atlantic ocean current reverse causing considerably cooler temperatures for a long time in places like Northern Europe, Toronto and New York?
There exists a clear record of what has happened in the past. Will it happen again? We need to know.
Is Canada Ready...
Bron en Copyright © 2009 IsCanadaReady.Com, All rights reserved. |
|
Alleen tijdens de temperatuurpieken, zoals tegenwoordig, is het voor mensen op het noordelijk halfrond een beetje een prettig klimaat op aarde.
Helaas duren die zgn. interglaciale periodes maar betrekkelijk "kort": zo'n 10.000 jaar van relatief snelle opwarming.
Daarna koelt het veel langzamer weer af en worden grote delen van het noordelijk halfrond bedekt met een heel dikke laag ijs.
Die ijstijden duren veel langer: wel ca. 100.000 jaar.
Het lijkt er in de aller bovenste grafiek wel op dat we aan het einde zijn gekomen van de laatste periode van opwarming. De website "Is Canada Ready"schrijft er het volgende over: |
|
 |
"The earth has a natural warming and cooling cycle that lasts just over 100 thousand years. The cycle goes from virtually no ice in the arctic, to substantial buildup of ice in the arctic. The melting of the northern polar ice cap is the main driver of this cycle. The complete melting of the polar ice cap is what triggers the next round of cooling. The natural flow of the Atlantic Ocean is what sustains the warming and cooling cycles. Once it is significantly melted, weather patterns irreversible change and a new glacial period begins. Earth has been in an inter-glacial period (warming period) for over 10 thousand years now. Most of the ice shield over North America and Europe has already melted except for Greenland. The oceans have already risen an estimated 120 meters and would rise another 6.5 meters if most of the ice on Greenland melts (as it did in the last interglacial period). How long before all of the Greenland ice melts and sea levels rise another 6 meters? 500 years? 200 years? What will happen after it melts? Will the Atlantic ocean current reverse causing considerably cooler temperatures for a long time in places like Northern Europe, Toronto and New York? There exists a clear record of what has happened in the past. Will it happen again? We need to know."
Een goede theorie over de huidige opwarming van de aarde moet bovengenoemd smeltingsproces, dat al 18.000 jaar gaande is, natuurlijk wel "meenemen"
Op de laatste Bilderbergconferentie (2011 ?) is inmiddels wel over Global Cooling gesproken.........(bron: Hajo Smit op climategate.nl d.d. 15-9-2011)
Ook de web-site iceagenow.info is er niet gerust op en toont vele historische klimaat-grafieken.
De allerbovenste grafiek van de 4 ijstijden laat zien dat de temperatuur van de aardatmosfeer de laatse milennia schommelde tussen een marge van iets minder dan plus of minus 2 graden Celcius.
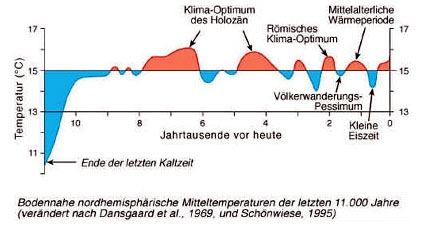
Dat is ook zichtbaar in de onderstaande 11.000-jarige grafiek voor het noordelijk half rond, waarin de gemiddelde temperatuur schommelt tussn slechts plus en minus 1 graad Celcius:
Noordelijk halfrond : de laatste 11.000 jaar (dus sinds de laatste ijstijd)
Zonder het broeikaseffect (en dus alleen verwarming van het aardoppervlak door zonlicht en aardwarmte) zou de temperatuur op Aarde volgens bepaalde theoretische modellen gemiddeld -18°C zijn (Elsevier, 21-6-08, p. 76 schrijft -16° Celcius), thans is zij + 15°C. Maar dat is een gemiddelde, zoals nevenstaande grafiek laat zien. Gemiddeld werkt de aard-atmofeer dus als een "comfortabele 33 graden verwarmende deken", zonder welke op aarde nauwelijks of geen leven mogelijk zou zijn: de aardkorst zou allemaal permafrost zijn.
Toch klopt de beeldspraak van een warme deken niet: Aan de evenaar blijft het altijd warm en aan de polen altijd koud. Verdamping en luchtstromen zorgen er voor dat het aan de evenaar niet al te heet wordt en aan de polen niet al te koud. Een gemiddeld klimaat van bijna altijd ca. 15 graden Celsius vind je op aarde (haast) nergens.
|
|
 |
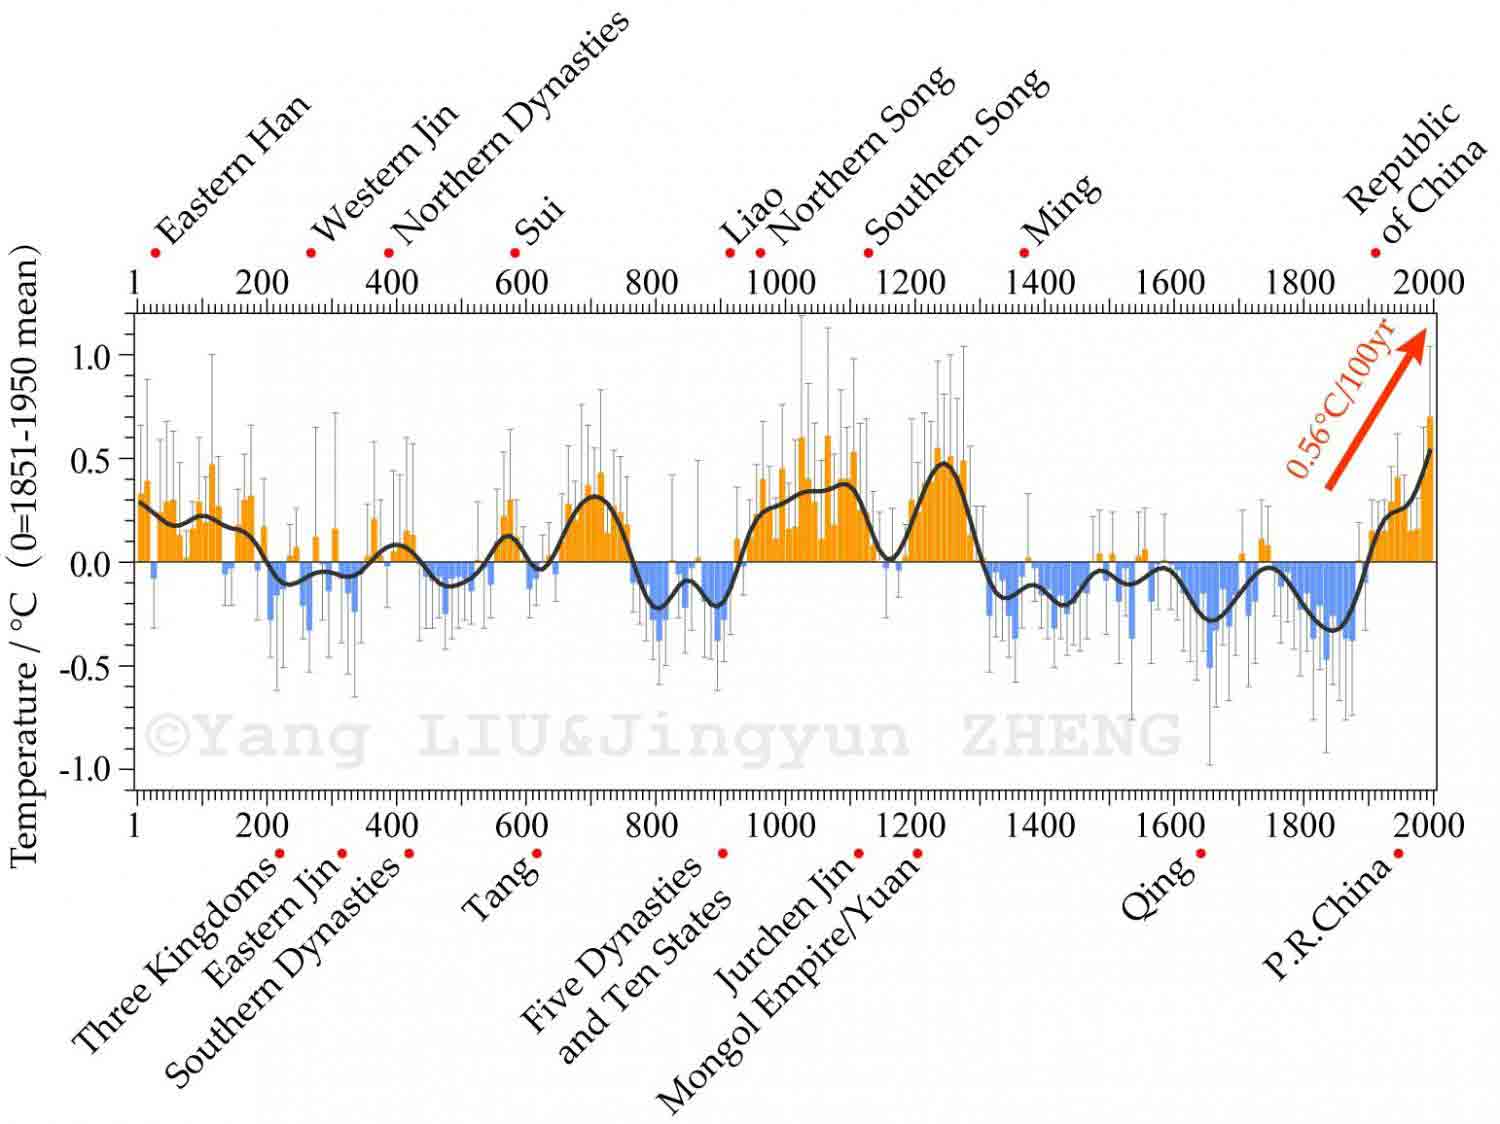
Voor China is de variatie in temperatuur de laatste 2000 jaar nog kleiner dan plus of minus 1 graad C. Schommelingenworden merendeels geschat op minder dan een halve graad C.
Hier zien we een relatief koude periode van ca. 1300 - ca. 1900 met dieptepunten in de 17e en 19e eeuw.
China de laatste ca. 2.000 jaar
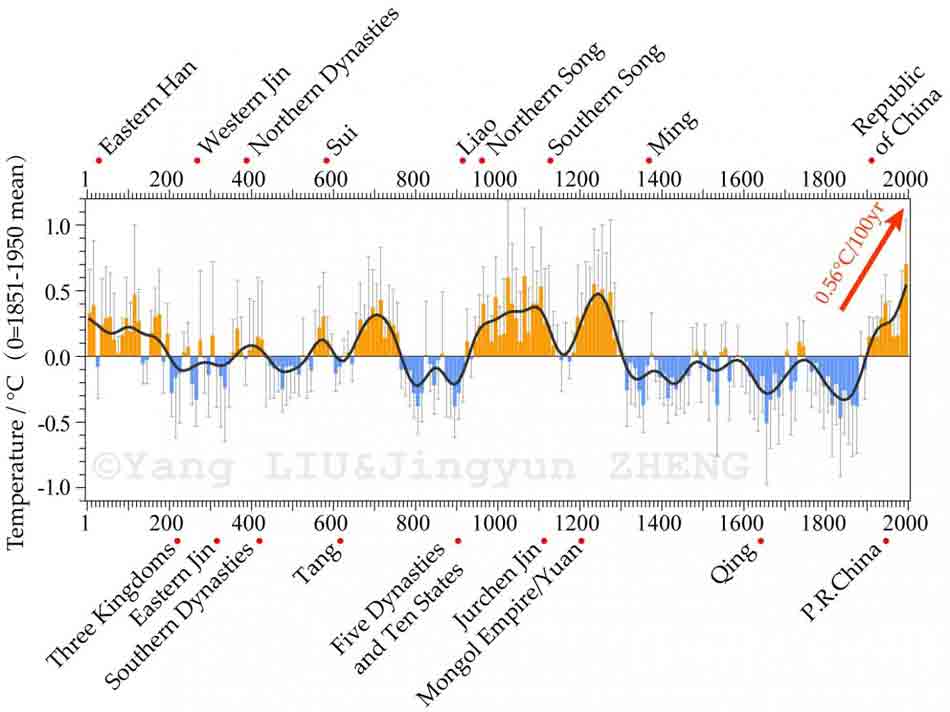
Klik on the graph for an enlargement
A great deal of evidence relating to ancient climate variation is preserved in proxy data such as tree rings, lake sediments, ice cores, stalagmites, corals and historical documents, and these sources have great significance in evaluating 20th century climate warming in the context of the last two millennia. Prof. Quansheng Ge and his group from the Institute of Geographic Sciences and Natural Resources Research, Chinese Academy of Sciences, collected a large number of proxies and reconstructed a 2000-year temperature series in China with a 10-year resolution, enabling them to quantitatively reveal the characteristics of temperature change in China over a common era. "We found four warm epochs," says Prof. Ge, "which were AD 1 to AD 200, AD 550 to AD 760, AD 950 to AD 1300, and the 20th century. Cold periods occurred between AD 210 and AD 350, AD 420 and AD 530, AD 780 and AD 940, and AD 1320 and AD 1900. The temperature amplitude between the warmest and coldest decades was 1.3°C."
Read more at: https://phys.org/news/2017-08-periods-20th-century-unprecedented-years.html#jCp (link verbroken ? Kijk dan hier).
De Kleine Ijstijd: ca. 1580 - 1850, met dieptepunt van ca. 1650-1705 à 1710, volgens sommigen tot 1725.
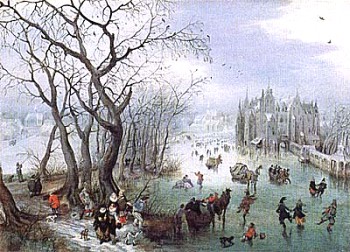
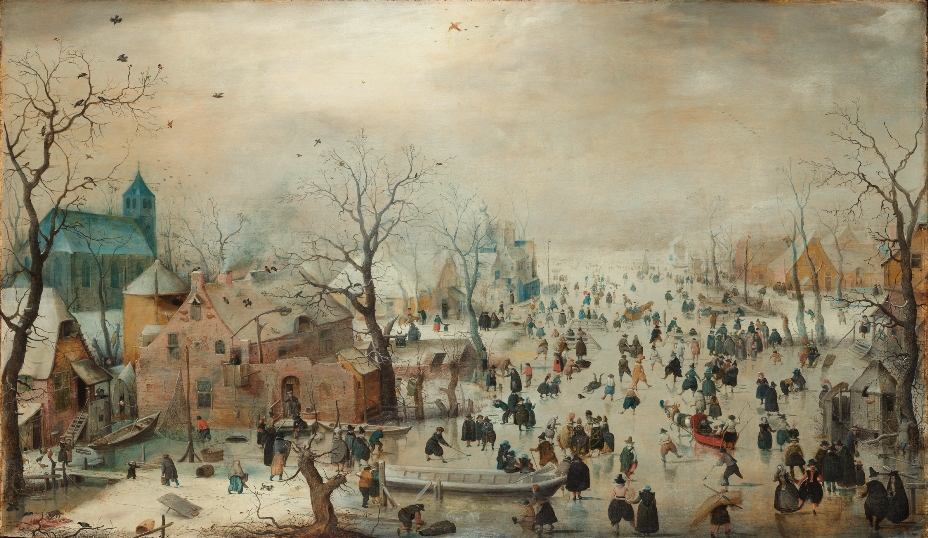
Adriaen van de Venne schilderde ijstaferelen in de Kleine IJstijd.
|
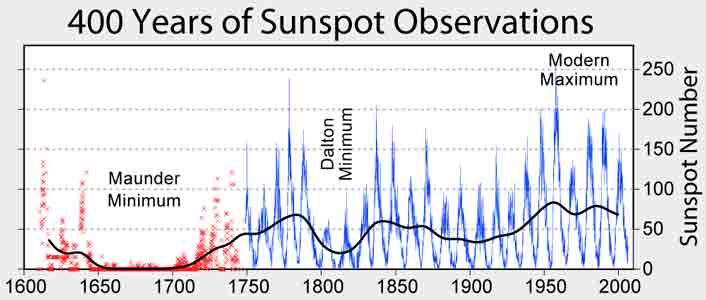
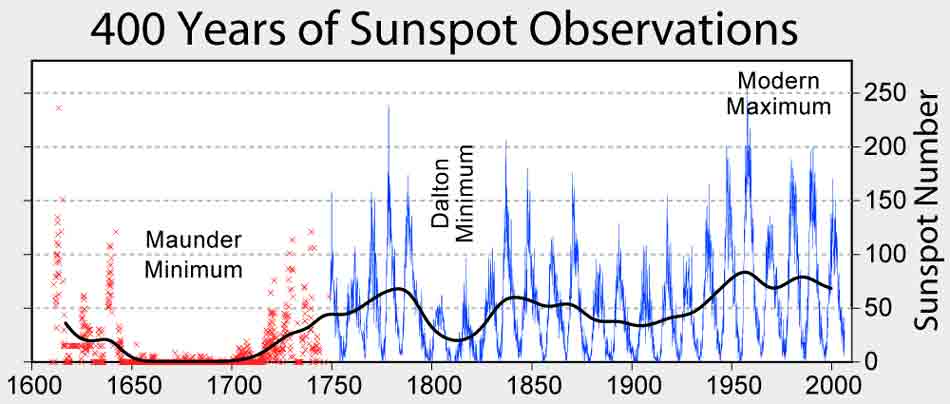
Na het zgn. Middeleeuws Optimum daalde de temperatuur om een tijd min of meer gelijk te blijven, totdat tussen 1580 en 1850 een koude tijd optrad, die wel als de ‘Kleine IJstijd’ wordt aangeduid, met als dieptepunt het Maunder Minimum (1645 – 1720; zie grafiek hier onder van 400 jaren zonnevlekken-observaties)) toen het in West Europa enkele graden kouder was t.o.v. de relatief warme Middeleeuwen en hedendaagse periode.
Uit die extra koude periode stammen de talrijke schilderijen van Hollandse ijspret, onder meer van Avercamp (klik hier voor 1 van zijn schilderijen) en Van de Venne (zie schilderij links).
Het Maunder Minium, genoemd naar de astronoom Edward Walter Maunder, is een aanduiding van een periode van nauwelijks zonnevlekken-activiteit van ca. 1650 - ca. 1705 à 1710 (Kees de Jager, 2009, interview). Anderen laten het doorgaan tot ca. 1725.
|
|
|
Bronnen:
- 2 foto's en veel teksten: Prof. Dr. A.J. van Loon in een artikel op kennislink.nl
Hij refereert naar:
Osborn, T.J. & Briffa, K.R., 2006. The spatial extent of 20th-century warmth in the context of the past 1200 years. Science 311, p. 841-844.
- Bert Amesz in www.klimatosoof.nl d.d. 17-3-2010: 'Stijgt de zeespiegel eigenlijk wel ?". |
|
Hier boven wordt gesproken (eigenlijk geschreven) over de periode 1580-1850, met met als dieptepunt het Maunder Minimum (1645 – 1720) toen het in West Europa enkele graden kouder was t.o.v. de relatief warme Middeleeuwen en hedendaagse periode
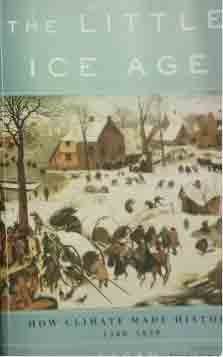
In het boek van Brrian Fagan, "The Little Ice Age: how climate made history" wordt de periode 1300 - 1850 genoemd.
Het Middeleeuws Optimum en de Kleine Ijstijd worden wel in verband gebracht met meer of minder dan gemiddelde activiteit van zgn. zonnevlekken (Eng. sunspots). Zie een videopresentatie.
Onderstaande grafiek is ontleend aan een artikel d.d. 27-4-2018 op www.armstrongeconomics.com
Literatuur:
-Bijkerk, André, De Kleine Ijstijd van 1945-1974, Climategate, 15-9-2015
- Frost fairs, Sunspots and the Little Ice Age, To be published in A&G, Astronomy and Geophysics, March 2017 (link verbroken ? kijk dan hier)
Afkoeling in het recente verleden
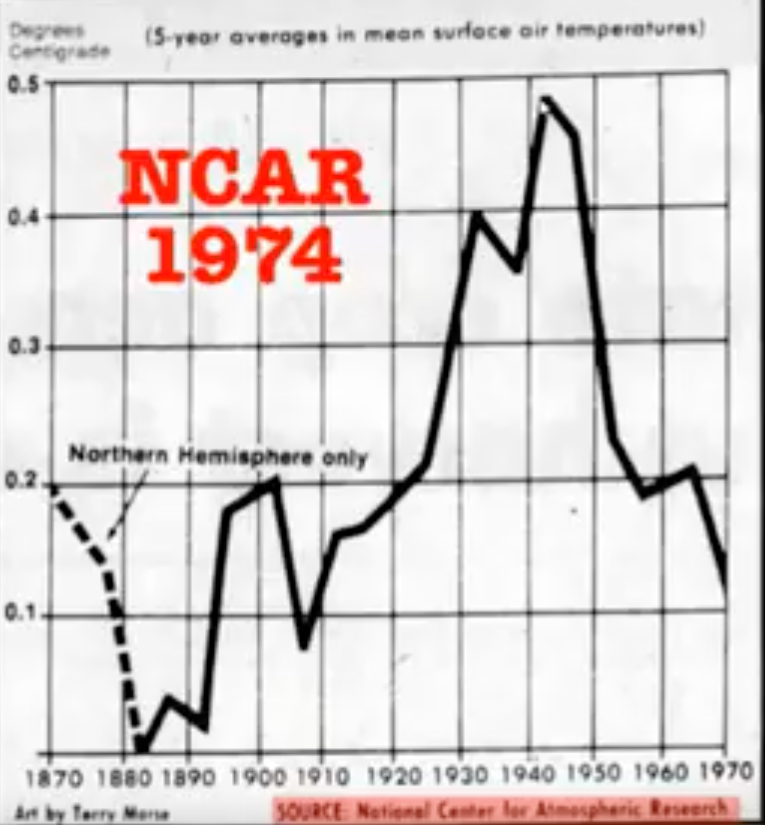
In de ca. 30 jaar tussen ca. 1942 en ruim 1970 koelde de gemiddelde aardtemperatuur met ca. 0,4 graad C.
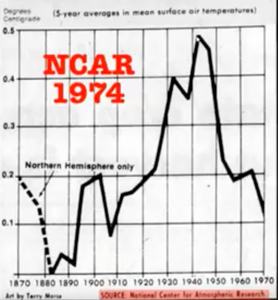
Hele wereld in graden Celcius (voor 1880 alleen het noordelijk half rond) |
|
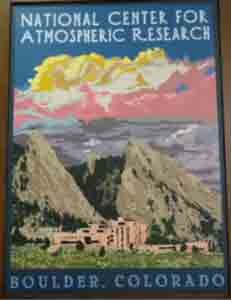
Centrum voor Atmosferisch Onderzoek - NCAR in Boulder, Colorado, USA
|
|
|
Grafiek van de NCAR (Centrum voor Atmosferisch Onderzoek) in Boulder, Colorado (USA)
Klik op de grafiek voor een vergrotingen;
(bron: Tony Heller, 20-11-2017 op Youtube).
Zie hier onder ook het artikel in Nature, dat in 1978 werd besproken in The New york Times
(klik op de tekst voor een vergroting)
(Nieuwsblad van het Noorden, 28-1-1974)
Op onze web-pagina "Klimaatverandering" geven we vele voorbeelden van vele krantenartikelen, wetenschappelijke artikelen, klimaat-theorieën en petiites van klimaat-wetenschappers aan de politiek, die waarschuwen voor een voortzetting van een kouder wordend klimaat.
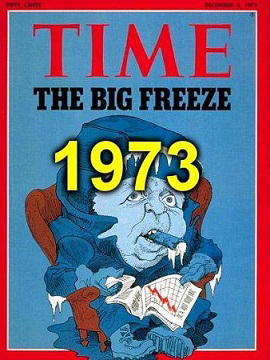
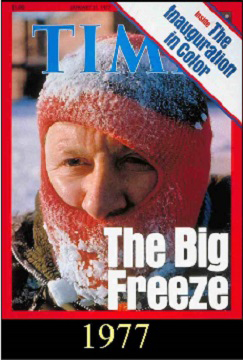
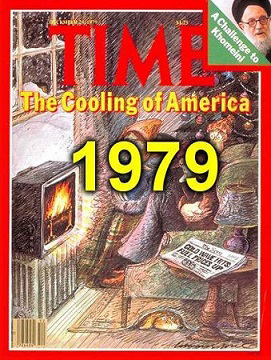
De pers was er vol van...............
De aard-atmosfeer-temperaturen schommelen
(en we weten niet goed waarom)
Maar men had er geen rekening mee gehouden dat het klimaat ook nog wel een geruime periode kan gaan schommelen (zie aller bovenste grafiek op deze pagina) voor we de volgende ijstijd ooit in alle hevigheid gaan meemaken.
Eerst kreeg de wereld nog even schrik voor een ingezette schommeling naar warmer weer en wederom dacht / denkt men lineair i.p.v. in golven.
En de CO2- utstoot van mensen kreeg de schuld van een opwarmend klimaat in een door het IPCC gepromote AGW-theorie, De Antropogenic Global Warming theorie (de theorie van de door mensen veroorzaakte opwarming van de aarde). Met ex vice-president Al Gore van de USA als prominente profeet van het nieuwe bijgeloof. En hoewel men algemeen aanneemt dat klimaatveranderingen onderhevig zijn aan een enorm complex van variabelen, die voor het merendeel nog onbegrepen zijn en ook door modellen en computers niet goed te berekenen zijn, richt men zich voor een klimaatveranderings-verklaring op slechts 1 variabele: een toename van de CO2 in de atmosfeer. Men denkt ook nog eens dat dat grotendeels komt door menselijke activiteiten. Dat alle insecten met elkaar nog meer CO2 uitstoten dan alle menselijke activiteiten is weinig bekend.
|
Het lijkt er sterk op dat de Westerse wereld het Verlichtingsdenken en de geweldige ontwikkelingen inde natuurwetenschappen weer eens terzijde schuift en weer eens massaal achter enkele vileine leiders aanloopt, die denken dat ze "het licht" hebben gezien.
Leiders, die - ondanks vele waarschuwingen van deskundigen - graag bereid zijn hun beschaving naar de ondergang te leiden, zoals Barbara Tuchman het zo beeldend voor vele culturen heeft beschreven in haar boek De Ivoren Toren.
Zie ook onze web-pagina over "Weergoden" |
|
(klik op de foto voor een vergroting)
|

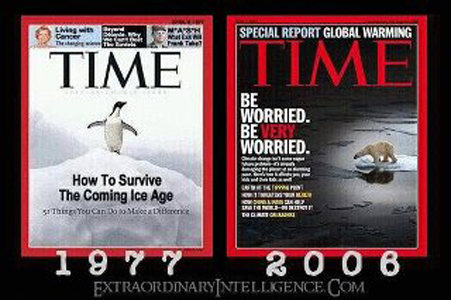
De angst en het alarmisme nemen toe: eerst Global Cooling, toen Global Warming, toen Catastrophal Global Warming, toen Climate Change (daarmee krijg je altijd gelijk, welke kant het klimaat ook op gaat), toen Climate Emergency / Catastrophe en nu al Global Extinction
We worden door het IPCC, de VN, de media, hysterische kinderen als Greta Thunberg en redeloze actigroepen als Rebellion Extinction wijs gemaakt dat dat de Apocalyps nabij is en dat door onze eigen schuld.
Maar voorlopig gaat de temperatuur van de aard-atmosfeer gewoon regelmatig op en neer, om redenen die we nog slecht begrijpen. Zie ook onze webpagina "opwarming van het klimaat", waar de schommelingen sinds 1850 getalsmatig worden beschreven.

(klik voor vergroting)
de Pauze (Engl. Pause; Lat: Hiatus)
En als het niet kouder of warmer wordt op aarde, dan blijft de temperatuur ook wel eens een tijd vlak.....
Na 1998 is de gemiddelde wereldtemperatuur niet significant gestegen, ondanks de sterke stijging in het CO2-gahalte tot boven de 400 ppm.
Dat de temperatuur op aarde decennia vlak bleek te verlopen was niet in overeenstemming met en ook niet voorspeld door de AGW-theorie en door daarop gebaseerde modelberekeningen.
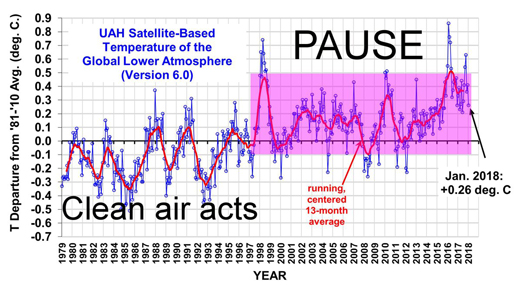
Bovenstaande grafiek: UAH graphs of Spencer and Christy show a pause during the last 20 years. Klik voor vergroting.
Dat de temperatuur op aarde vele jaren vlak bleek te verlopen, terwijl de CO2-concentratie in de lucht bleef stijgen tot ca. 420 ppm in 2018, was niet in overeenstemming met en ook niet voorspeld door de AGW-theorie en door daarop gebaseerde modelberekeningen.
Afkoeling van de aarde in de naaste toekomst ?
Maar, pas op: There are lies, damned lies and statistics !

De winter van 2020 -2021 doet er wel even aan denken, bijna een elfstedentocht !
Maar klimaat-alarmisten laten zich hierdoor niet uit het veld slaan !!!
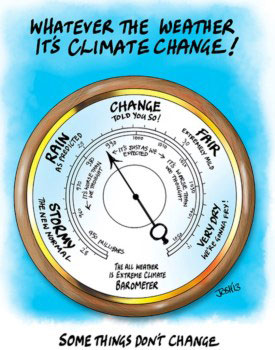
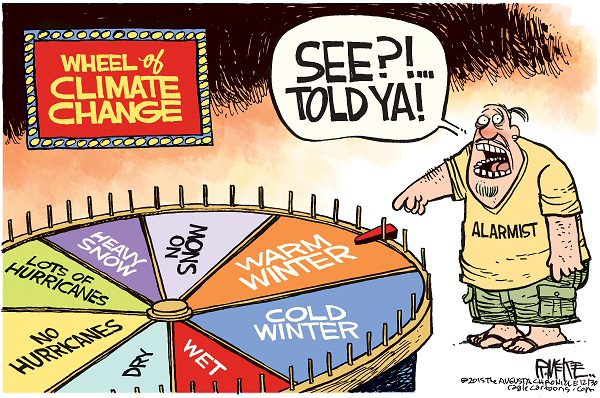
Van "Global Warming" naar "Climate Change"....................
The activists now prefer to call it “climate change”. This gives them two advantages:
- It allows them to seize as “evidence” the inevitable occurrences of unusually cold weather as well as warm ones.
-
The climate is always changing, so they must be right.
(bron: Global Warming as Religion and not Science, by John Brignell, June 2007)
“If it gets warmer, climate change.
If it gets colder, climate change.
If it stays the same, climate change is coming.
Drought – climate change.
Flood – climate change.”
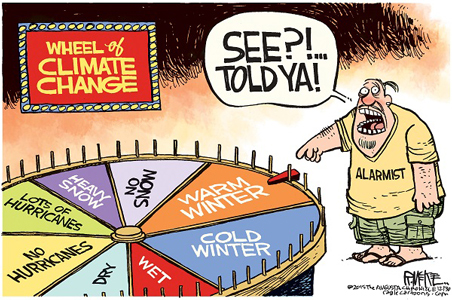
If ALL observations are “proof” of a theory, that is proof that the theory is complete pseudoscience.
Literatuur:
Deze website is een activiteit van dr. Hugo H. van der Molen, Copyright 2007 e.v.
Mail ons uw commentaar, aanvullingenen en correcties !
en Facebook of Linkedin

